
That's not because the information doesn't exist.
It's because future dividend income is surprisingly difficult to organize.
Payments arrive on different schedules. Some holdings pay monthly. Others pay quarterly. Dividend rates change. Positions are added and sold.
Before long, many investors find themselves bouncing between brokerage accounts, spreadsheets, and old statements trying to answer a basic question:
What income should I actually expect over the next year?
For retirees and investors who depend on portfolio income, having a clearer answer can make planning significantly easier.
Why Future Dividend Income Is Harder to Track Than Most Investors Expect
At first glance, projecting dividend income sounds simple.
You own shares. Those shares pay dividends. Add everything together and you're done.
In reality, things become more complicated.
A typical income portfolio may contain dividend stocks, ETFs, REITs, closed-end funds, business development companies, and preferred shares. Each may have a different payment schedule.
Some income arrives monthly. Other payments arrive quarterly. Some positions may announce dividend increases while others maintain the same payout for years.
The result is that many investors end up with a rough estimate of annual income—but very little visibility into when that income is expected to arrive.
There Are Two Ways to Project Dividend Income
Most investors take one of two approaches.
Do It Manually
This usually means building and maintaining a spreadsheet.
Use a Dividend Tracking Tool
Dedicated software automates much of the work and organizes future income projections automatically.
Both approaches can work. The difference is how much time and maintenance are involved.
Let's start with the manual method.
The Manual Method
Step 1: Gather Your Holdings
Begin by creating a complete list of dividend-producing positions. For each holding, you'll want the number of shares owned, current dividend rate, and payment frequency.
Most brokerage accounts provide this information.
Step 2: Estimate Annual Income
For each position, multiply Shares Owned × Annual Dividend Per Share.
500 shares × $2.00 annual dividend
= $1,000 projected annual income
Repeat the calculation for each position and add the totals together. At this stage you'll have a rough estimate of your portfolio's annual dividend income.
Step 3: Map Payment Schedules
This is where things become more interesting.
Knowing annual income is helpful. Knowing when income is expected to arrive is often more valuable.
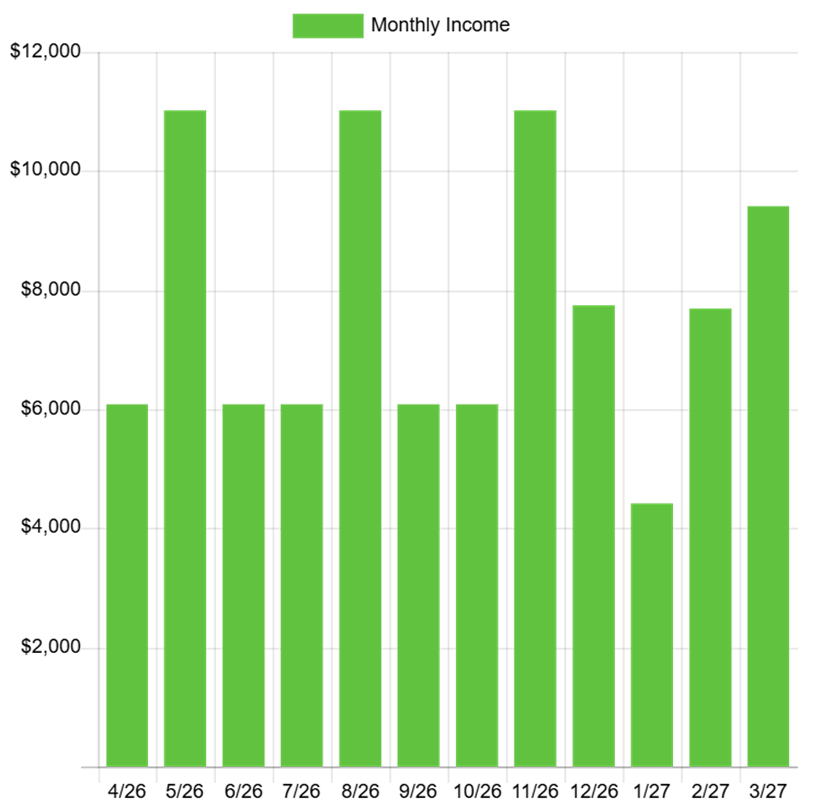
Consider two portfolios that both generate $24,000 annually. One may produce income relatively evenly throughout the year. The other may concentrate payments into only a few months.
The annual income is identical. The cash-flow experience is very different.
Step 4: Organize Income by Month
Once payment schedules are identified, income can be mapped across the calendar.
Instead of seeing only an annual total, you begin seeing January, February, March and the remaining months broken out individually. This provides a much clearer view of future cash flow.
Where the Manual Approach Starts to Break Down
For a small portfolio, the process isn't particularly difficult. The challenge comes from maintaining it.
Every time you add a new position, sell shares, receive a dividend increase, experience a dividend reduction, or reinvest distributions, your calculations need to be updated.
For investors with 15, 20, or 30 income-producing holdings, the spreadsheet can quickly become more work than expected.
This is why many dividend investors eventually start looking for a more efficient approach.
A Simpler Way to Project Dividend Income
Rather than manually maintaining calculations and payment schedules, dividend tracking tools organize the information automatically.
Instead of updating spreadsheets, investors can view projected annual income, expected monthly income, income by holding, dividend payment schedules, and upcoming dividend events in one place.
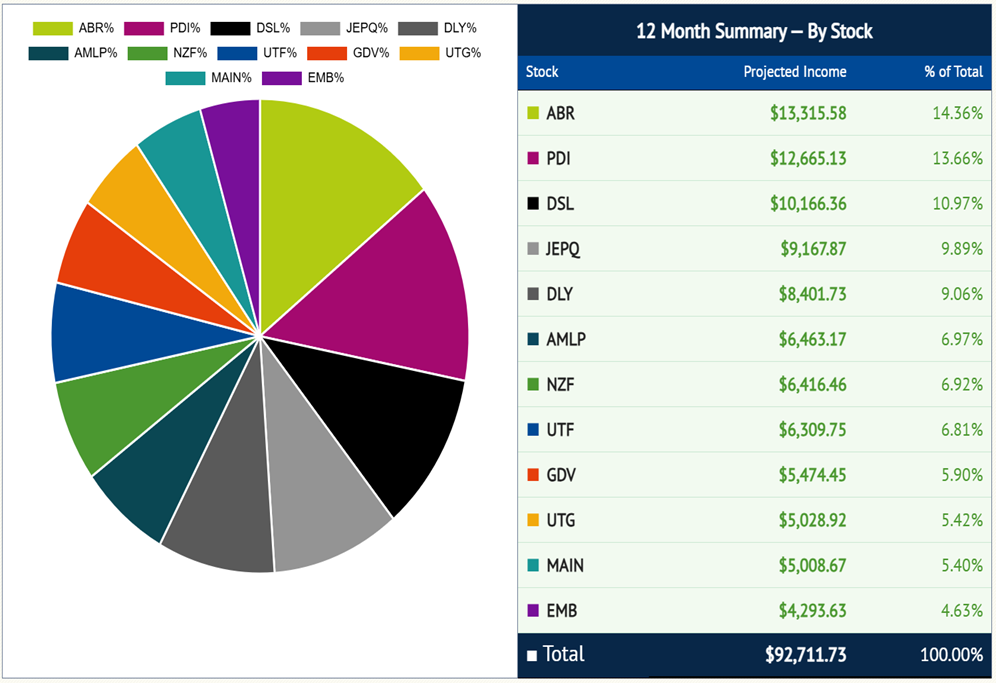
The goal isn't simply to estimate a yearly total. The goal is to understand how income is expected to flow through the portfolio over time.
What Good Dividend Income Projections Actually Tell You
The most useful projections answer practical questions such as:
- Which months generate the most income?
- Where might income be lighter?
- Which holdings contribute the most cash flow?
- How concentrated is income among a small number of positions?
- How much income is expected over the next year?
Those insights can help investors make more informed decisions about retirement income planning.
How Accurate Are Dividend Income Projections?
No projection can guarantee future dividends. Companies can increase, reduce, suspend, or eliminate distributions.
However, projections remain useful because they provide an estimate based on currently available information.
The goal is not perfect prediction. The goal is better visibility.
Key Takeaways
- Projecting dividend income starts with understanding your holdings.
- Payment schedules matter just as much as annual income totals.
- Monthly income views often provide more useful planning information than annual yield figures.
- Maintaining projections manually becomes more difficult as portfolios grow.
- Dividend tracking tools can simplify the process significantly.